Thursday 12 April 2012

Master Thesis Project: Development of vision based system to estimate fat content in slices of dry cured ham


Introduction

An essential component of the quality of the dry cured ham is their fat content. Fat content itself can be divided into three different groups, subcutaneous, inter-muscular and intramuscular, Figure 1a. Computer vision technology has been implemented recent years to determine the quality assessments in ham products, such as segmentation method.

As a starting point we have to concentrate on marbling of intramuscular fat. While the subcutaneous fat can be easily segmented, inter and intramuscular fat are more complicated to be segmented. We have to concern on how to divide the ham area become two areas which is separated by inter-muscular fat. These regions are parts area that will be counted their marbling of fat content, Figure 1b. Even this process is complicated, marbling fat content is very important to quantify for determining classification of ham quality parameters. Using model mathematic from the statistic of fat content can be find the correlation between segmented areas result with the chemical data of slices fat obtained by IRTA using chemical methods (ground truth). Then the model and the process segmentation result can be validated using slices from other hams.


The aims of this research is doing the fat segmentation of dry cured ham slices automatically using computer vision techniques using pictures taken from computer tomography images and estimate fat content from these slices. Thus, as the final result we can classify the quality of ham by the fat content.

Literature Review

Some literature related in this problem have been studied. First literature is rapid estimation of fat content in salmon fillets by color image analysis. This research done by Stien et all in 2007 has aim to develop a method for automatic a fat content in salmon fillets by means of image analysis and use this to determine the area of white stripe visible on the fillets surface compared to total area of the fillet. The method that used is on steps following:

Step-1: Background removal or discrimination of the fillet from the background. We have to find the fillet region based on 3 layers R, G, and B.

Step-2: Discrimination of the lipid stripes from other parts of the fillet. Using a global threshold where in a large area of false segmentation for all possible threshold values in both the G and B color layers. In the image, the muscle in the abdomen typically has the same color as the fat strips in other parts of the fillet. This is probably caused both by non-uniform lighting on the scene and difference in pigmentation between different parts of the fillet. Applying the 3x3 median filters on G-layer to remove noise. Then apply adaptive threshold.

Step-3: Estimation of fat content by image analysis.

Second literature is development of a hybrid image processing algorithm for automatic evaluation of intramuscular fat content in beef M. longissimus dorsi. This research aims to separate the lean from the other part fat and background by extract intramuscular fat (IMF) particles within the LD muscle from structural features of inter-muscular fat surroundings the muscle. This method as follows:

Step-1: Noise removal. To remove the noise we have to compare the pixel with the other neighbor pixels and make a region and give the weight. Concern on the color and distance of two pixel that called (ζ,x). x is the pixel that will be determined as noise or not and ζ is the neighbors that will be compared.

Step-2: Segmentation. This research use unsupervised clustering methods, the fuzzy c-means for segmentation. The advantage is that each image pixel has a membership grade indicating its belongingness degree to each cluster by the introduction of fuzziness. But, the problem is FCM does not incorporate information about spatial context, causing its sensitivity to noise and other imaging artifact. Another problem is FCM use Euclidean space to measure the similarity between prototype and data points, with fail on separation boundary cluster in nonlinear case.

Materials and Method

Sample Preparation

Experimental samples were provided by Institute the Research and Technology Food and Agriculture (IRTA), Gerona, Spain. The method that used to gain the images is using FoodScan. This equipment is based on near infrared transmission (NIT) and is a non-destructive technology used to determine different parameters in food products. From a tungsten-halogen lamp, light is guided through an optical fiber into the internal moving-grating monochromator, which provides monochromatic light in the spectral region between 850 and 1050 nm. The light is transmitted through the sample, and the unabsorbed light strikes a detector. The detector measures the amount of light and sends the result to the digital signal processor, which communicates with the personal computer (where the final results are calculated thanks to a previously developed calibration to determine fat content).

The sample is placed in a cup and positioned inside the FoodScan sample chamber. The sample cup is rotated during the analysis process to sub scan various zones of the test sample, which are then merged together for the final result. This procedure provides a more representative result from potentially nonhomogeneous samples.

Besides take the images, IRTA also retrieve the ground truth data of fat content using SOCTEX. This equipment is based on a chemical method which has two steps. In the first step, an acid digestion is carried out. In this step the fat that is bound to other non-solvent soluble as e.g. proteins are separated. This step allows the bound fat to be extracted in the solvent extractions.

In the second part is carried out an extraction with hexane. This step in turn is divided into three times: boiling time, rinsing time and recovery time. The objective is completely dragging the fat contained in the sample. Then weighed the fat extracted.

Preprocessing Step

This step has objectivity to gain two regions of ham area by segmentation process. The original image has wide resolution, the first step is cropping image and apply threshold and median filter 10 by 10 size of windows to remove the background and masking. To get the ham area Gaussian filter using 3 by 3 size of windows, normalization, and threshold on 0.1 and 0.6 to make mask of ham area. From this result there are conditions that the ham area has been divided become two regions or not yet. If already divided the process is done, but if not yet have to find the Inter-muscular fat that will split the area. By invert, normalization, and adaptive threshold we can retrieve the IMF (Inter-muscular Fat), and also region threshold applied to remove the noise. The adaptive threshold is worked to find the outer shape too.

This process has condition that IMF can be detected or not, it is depends on threshold, but to make it automatic, the condition should be work by find the center from the outer shape. However if we found the Inter-muscular we can use the center area of this area. This center will be used to reconstruct the Inter-muscular to be able split the region. Using minimum distance (Ecludiance distance applied) the line between center and nearest point of outer shape developed using linear interpolation and morphological operation. The final stage labeling and boundary applied to get the two regions. The whole process can be seen in Figure 3.

Fat Content Extraction

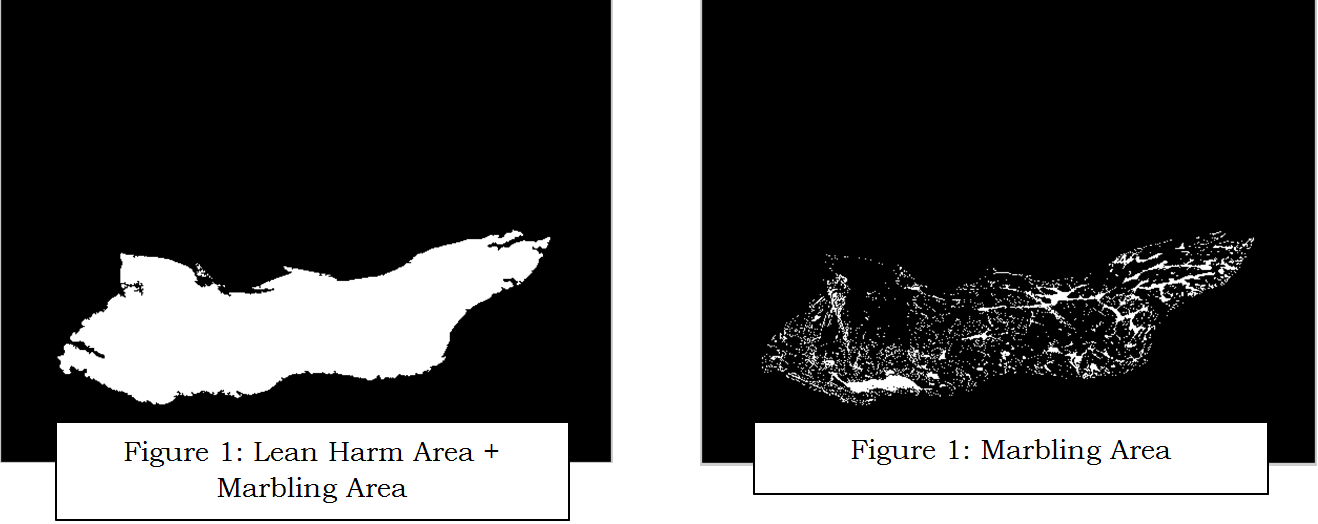
Two steps were developed to perform the contrast enhancement. The first step used twice the green channel to create the grey image (DoubleGreen) and the second used the product of the red, green and blue channels to create the grey image (TotalMix). For DoubleGreen, observation of the red, green and blue channels showed that contrast between lean muscle and marbling fat was noticeable in the green channel. When the DoubleGreen image was then subtracted marbling pixels dropped to or very near zero and muscle pixels returned to their values in the DoubleGreen image. Tripling of this image created a robust contrast between muscle and marbling pixels. For TotalMix, observation of pixel values in a full RGB color image showed that muscle pixels had lower values in all three color channels. The contrast enhancement and fat content extraction can be observed on Figure 3.


Figure 3. Proposed Algorithm

Progress Result

Result of the algorithm above is divided to three parts. First part is the preprocessing result and the second is fat content extraction. The final result is visualization fat content (marbling fat) on chart.

1. Preprocessing Result

Preprocessing result is related on segmentation step results that have been described before. The final result of segmentation can be seen clearly in the last image of this part.


The Inter-muscular reconstrution result is here.


Visualization of two regions from the measurement and ground truth (expert judgment).


2. Fat Content Extraction

Marbling area has been retrieve using enhancement method. Here is the result of this step.


3. Visualization

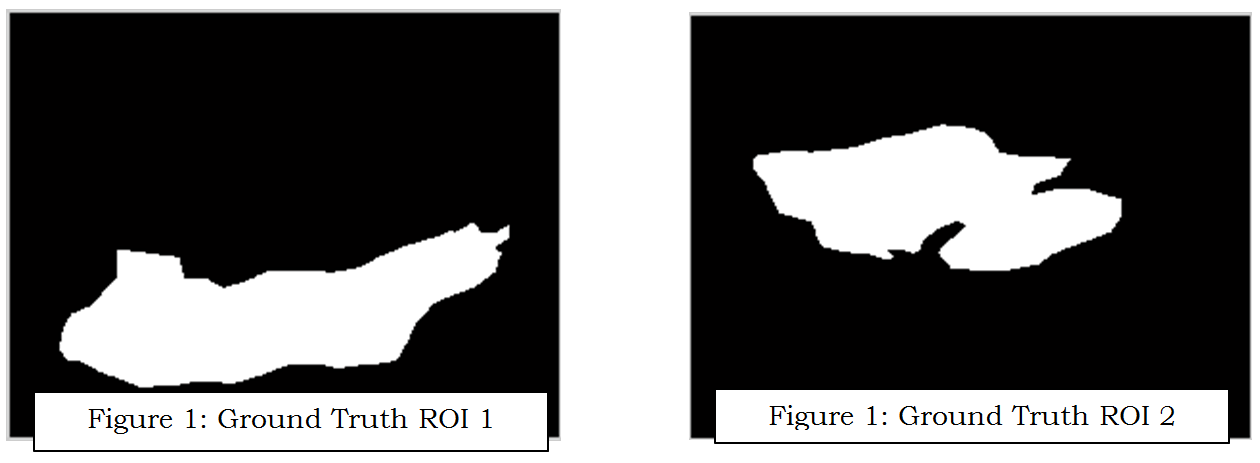
This result contains two kind plotting data result. The first one is the accuracy of segmentation process that divide ham area become two regions. The measurement that used is Jaccard Coefficient and Dice Coefficient. Almost all of the image have been segmented successfully upper 90% based on Dice Coeeficient and all image 70% success segmented based on Jaccard measurement.


The last result is a comparison measurement between result using enhancement method and chemical data as ground truth. This result still not good enough, the correlation of two data is 0.32 for Region of Interest 1and 0.65 for Region of Interest 2. This result still in progress and improvement using Fuzzy C-Means Clustering.


REFFERENCESS

  1. Patrick Jackman, Da-Wen Sun, and Paul Allen, Recent advances in the use of computer vision technology in the quality assessment of fresh meats, Trend in Food Science & Technology, 22 (4) (2011), pp. 185–197.
  2. J. Jia, A.P. Schinckel, J.C. Forrest, W. Chen, and J.R. Wagner, Prediction of lean and fat composition in swine carcasses from ham area measurements with image analysis, Meat Science, 85 (2) (2010), pp. 240–244.
  3. L.H. Stien, A. Kiessling, F. Manne, Rapid estimation of fat content in salmon fillets by colour image analysis, Journal of Food Composition and Analysis, 20 (2) (2007), pp. 73–79.
  4. N. A. Valous, K. Drakakis, and Da-Wen Sun, Detecting Fractal Power-law Long-range Dependence in Pre-sliced Cooked Pork Ham Surface Intensity Patterns Using Detrended Fluctuation Analysis, Meat Science, 86 (2) (2010) 289-297.
  5. F. Mendoza, N. A. Valous, Da-Wen Sun and Paul Allen, Characterization of Fat-Connective Tissue Size Distribution in Pre-sliced Pork Hams Using Multifractal Analysis, Meat Science, 83 (4) (2009) 713-722.
  6. C. J. Du, Da-Wen Sun, P. Jackman and P. Allen, Development of a Hybrid Image Processing Algorithm for Automatic Evaluation of Intramuscular Fat Content in Beef M. Longissimus dorsi, Meat Science, 80 (4) (2008) 1231-1237.
  7. Tan J, Meat quality by computer vision, Journal of food engineering, 61 (1) (2004), pp. 27-35.

Read More..

Saturday 26 November 2011

Sedikit Tentang Pattern Recognition untuk Pengolahan Citra


Tulisan ini saya dedikasikan untuk diri sendiri agar saya dapat mengingat mata kuliah ditempat saya belajar saat ini dan juga dapat saling berbagi dengan rekan-rekan para pengunjung blog ini. Pada postingan kali ini hanya akan sedikit dibahas mengenai pengenalan Pattern Recognition (Pengenalan Pola). Untuk praktik, saya akan mengulasnya di dalam blog khusus saya untuk programming, klik disini.

Beberapa buku dan web sources yang saya rekomendasikan sebagai berikut:
Book:
- Pattern Classification, R.O. Duda, P. E, Hart & D. G. Stork
- Pattern Recognition and Machine Learning, C. M. Bishop
Web Source:
- http://ocw.mit.edu/courses/mathematics/18-06-linear-algebra-spring-2010/
- http://academicearth.org/courses/machine-learning

Mari kita mulai, apa itu pattern recognition. Dalam ilmu computer vision, pattern recognition disebut sebagai proses yang bertujuan untuk memberikan satu hasil nilai atau label pada satu inputan data objek yang berdasarkan pada algoritma tertentu (klasifikasi). Misalnya dalam penelitiannya, Luca Giancardo (PhD Bourgogne University), membedakan jaringan pembuluh darah (blood vessel) dan bagian lainnya pada retina. Dia membedakan jaringan darah dan bagian lainnya dengan label positif (+) dan negative (-). Hal ini bertujuan untuk membedakan bagian retina yang dapat menyalurkan darah dan pada akhirnya dapat dilakukan pendeteksian terhadap penyakit diabetes pada seseorang. Dengan demikian pattern recognition dalam hal ini dapat dimanfaatkan sebagai medical imaging.


Gambar 1. Struktur Mata.


Untuk memberikan label pada data dibutuhkan sebuah keputusan. Dalam kasus tersebut dibutuhkan kemampuan satu computer untuk menentukan manakah yang akan diberi label positif (jaringan pembuluh darah) dan yang mana akan diberi label negative (bagian lainnya).


Gambar 2. Pengambilan keputusan pada pengolahan citra.


Untuk menentukan keputusan tersebut dibutuhkan beberapa tahap. Tahap-tahap tersebut dapat dilihat pada gambar “Bagaimana sebuah mesin pattern recognition membuat keputusan”. Tahap pertama ada ekstrasi fitur dari data masukan. Ekstrasi fitur adalah satu proses yang digunakan untuk mencari karakteristik dari setiap data yang diperoleh, misalnya dalam kasus ini dari data image, sehingga karakteristik itu sendiri dapat berupa nilai matrik atau vector yang berasal dari pixel image tersebut. Hasil dari porses ekstrasi fitur sering disebut sebagai interest point atau feature key. Sedangkan metode yang dapat digunakan adalah Edge detection, Grey level, Texture statistics, SIFT, dan masih ada segudang metode sampai saat ini. Biasa metode ini diterapkan sesuai dengan kondisi image dan hasil yang diinginkan. Misalnya image hasil dari sebuah pencitraan scene atau image out-door dengan masalah intensitas, geometrik, dll. Hasil tersebut akan sangat berbeda dengan image yang dihasilkan di bidang medis, yang biasanya berasal dari pencitraan in-door dengan intensitas cahaya yg konstan dan geometrik yang teratur.

Kemudian tahap selanjutnya adalah normalisasi fitur atau juga pengurangan dimensi vektor. Hal ini dilakukan karena fitur vektor yang dihasilkan pada proses sebelumnya memiliki dimensi yang tinggi, sehingga akan memperlambat kinerja pada tahap selanjutnya yaitu klasifikasi. Selain itu, fitur vektor yang diperoleh mengandung noise yang juga dapat memberikan nilai baik pada klasifikasi atau bahkan bisa menyebabkan kinerja classifier tidak optimal. Untuk normalisasi metode yang dapat digunakan adalah gaussian normalizer, whitening, dll. Untuk mereduksi dimensi dapat digunakan Proncipal Component Analysis (PCA), Fischer Linear Discriminant (LDA), atau Independent Component Analysis (ICA).

Pada akhirnya untuk menentukan satu keputusan, maka dapat dilakukan proses klasifikasi. Mengacu pada pengertian pattern recognition, klasifikasi disini dapat diartikan sebagai algoritma yang dapat digunakan untuk membedakan satu objek kedalam sebuah kelas yang spesifik (kategorisasi). Dalam pengolahan citra (image processing), metode atau algoritma yang dapat digunakan misalnya Bayesian, K-NN, SVM, D-Tree, dll.

Tulisan kali ini cukup sampai disini. Tertarik dengan perbedaan apa itu klasifikasi dan apa itu clustering dalam pengolahan citra? Mudah-mudahan tulisan selanjutnya akan membahasnya. Untuk mengingatkan untuk programming saya menggunakan MATLAB, dan dapat dilihat beberapa tutorial dan penyelesaiaanya di Blog saya yang lain, klik disini.
Read More..

Wednesday 24 February 2010

Web Design

Every developer site has to prepare his site's design to give a good result. Every designer has purpose to make an application to be user friendly. Why? Because all the application can be comfortable for user if the application use the rule on the design. In this case, we are talking about the web development. We compare the Harvard's site and Oxford's site. This is two link for download the documents. The first one is the complete explanation about the comparison of two site, please download. The second one is the presentation document, please download.

From the comparison, we have two decision. First, if we are the ordinary person will choose the Harvard's Site. It's caused the site is very simple and clear in the interface. The site use the modern style likes the all site from USA. Second, if we are the expert person will chose the Oxford's Site. Why? It's caused Oxford's site gives information detail, every thing which has relation with the site is complex but important. The example is the Library Online.


Read More..

Tuesday 26 January 2010

Wall-E: The Lonely Robot

The experience of "WALL-E" is a little different from what audiences will take away from it. In the moment, it's intermittently transcendent, heartrending and beautiful ... and busy, repetitious and boring. But in memory, "WALL-E" should grow, because the weaker parts will drop out of mind, while the moments of sheer brilliance, which are one-of-a-kind, will gain in importance.

WALL-E is the robot who compacts the trash and places it on the piles. He has one friend, a cockroach, who's the only thing left living (cockroaches can survive almost anything), and, all in all, it's a bleak existence in a desolate landscape. But here's the touch of genius: WALL-E collects things. Whenever he sees something he finds interesting, something that he somehow intuits isn't trash, he puts it in an old cooler and brings it home. WALL-E is drawn to signs of life; thus, his fascination with his old VHS of "Hello, Dolly," which he watches obsessively.

For as long as it stays on Earth, "WALL-E" is a great film, and on its way to being one of the masterpieces of the decade. But then it leaves Earth, and, once it does, it goes into pedestrian territory. WALL-E and a companion probe named Eve (who is very white and sleek and looks like something made by Apple) go back to Eve's spaceship. They go to bring back a small plant that indicates that Earth can once again sustain life.

The spaceship scenes are not without charm or imagination. The spaceship contains all that's left of humanity, thousands of people living on the equivalent of a luxury liner, with all their needs attended to by robots. Because they're lazy and never need to move, the people are all enormously fat. The spaceship has become its own culture, having been flying, with the human species in exile, for 700 years.

Once WALL-E and Eve arrive on the ship, the story doesn't have much distance to travel, but ways are found to stretch out the experience - and that's where "WALL-E" goes wrong. The film loses touch with the poignancy and profundity of the Earth scenes and becomes gimmicky, slapsticky and cute, with a glossy sheen in contrast to the grit of the opening.


This film focused on human and computer interaction called robot. This movie shows so beautifully the work of human hands. Humans created robots so that robots can help people to do their jobs. Robot that have been given the ability of artificial intelligence such as neural networks capable of providing the robot to learn from their environment.

Although currently in real life it is difficult to implement, people still find a solution with such a precious creativity. Such as robots that have been created by the Japanese, specifically the creation of scientists from Honda, which is Asimo, who can follow the movement of people and able to interact with humans. However, current technological limitations are the limitations of memory and the device can support the AI itself.
The human race is eventually encountered, but the tone with which they’re depicted is muddled. They are a little too easily redeemed for my taste given the catastrophe they created back on Earth and ignored for so long. Without giving too much away, I think it’s a missed opportunity for the film to portray humans as victims of their own technology (too ingenious for their own good) instead of creatures with a disappointing tendency to do or create anything that fosters a sense of blissful ignorance. WALL-E makes a couple cute 2001 homages here and there, but it neglects the deeper, darker Kubrickian theme of humanity as a race paradoxically bent towards its own demise.

The development of robots, as portrayed in the movie WALL-E is so charming and very interesting. People can be coupled with computer equipment capable of walking, talking, serving, and even be able to give an opinion on us. But it also gives a negative impact on human life. Interface is quite interesting to make people negligent and easy to be empowered by his own robot. We still have to provide limits on the work of creation. a tool may be seen as a remarkable work, if the tool also gives us a lesson for the better. Tools may like humans, but humans should not be such a tool.


[Free Download the Movie "Wall-e"]

Read More..

Monday 25 January 2010

Erlang Bahasa Back-end dari Erricson

Pernahkah mendengar bahasa Erlang???
Ya, hanya segelintir orang yang mengetahui tentang bahasa pemrograman ini. Bahasa ini sering disebut dengan bahasa back-end. Erlang adalah bahasa fungsional, dengan evaluasi yang ketat, single assignment, dan pengetikan dinamis. Erlang sangat cocok untuk aplikasi yang membutuhkan pengolahan sistem terdistribusi, soft real time, sistem konkurensi, misal untuk sistem telekomunikasi untuk mengendalikan switch atau pengkonversi protokol. Juga untuk server untuk aplikasi Internet, misal mail server, WAP server. Bisa juga untuk aplikasi telekomunikasi, misal untuk messaging layanan mobil. Erlang bisa juga digunakan aplikasi database yang membutuhkan persyaratan soft real time

Di awal pengembangan Erlang pada tahun 1982-1985, Ericsson mencoba lebih dari 20 bahasa pemrograman yang ada saat itu, dari C, hinggal LISP dan Prolog. Sekitar tahun 1987 bahasa Erlang mulai digunakan di lingkungan Ericsson. Berbagai fitur Lisp, Prolog, Parlog diserap dalam bahasa ini. Sejak tahun 1993, Erlang telah memiliki kemampuan untuk mendukung sistem terdistribusi, sehingga memungkinkan menjalankan sistem Erlang pada perangkat keras yang heterogen. Erlang mulai banyak digunakan di berbagai perusahaan dan organisasi.

Versi pertama ini dikembangkan oleh Joe Armstrong pada 1986. [1] Erlang mendukung swapping kode sehingga dapat diubah tanpa harus menghentikan sebuah sistem. [2] Erlang awalnya adalah bahasa original dari Ericsson, tapi dirilis sebagai open source pada tahun 1998. Erlang telah tersedia untuk berbagai sistem operasi dari VxWorks, MacIntosh dan berbagai Unix dan juga MS Windows.

Erlang merupakan lingkungan sistem dan bahasa pemrograman yang umum. Memiliki dukungan untuk konkurensi, sistem terdistribusi dan serta fault tolerance. Bahasa Erlang sangat cocok untuk penggunaan aplikasi telekomunikasi dan jaringan karena memang didisain dari awal untuk kebutuhan tersebut. Erlang menyediakan penanganan kesalahan yang baik. Menulis program yang dijalankan di mesin terpisah tidaklah sulit. Hal ini karena sejak awalnya Erlang memang didisain untuk mendukung aplikasi terdistribusi. Proses distribusi program terjadi secara transparan: program aplikasi tidak perlu peduli atau ditangani khusus sebagai program yang terdistribusi.

Konkurensi dan pengiriman pesan (message passing) adalah dasar dari bahasa Erlang ini. Aplikasi yang ditulis Erlang sering disusun dari ratusan atau ribuan proses ringan (lightweight proces). Perpindahan konteks (context switching), antara proses Erlang jauh lebih rendah dari perpindahan konteks antara thread pada program C.
Erlang menggunakan mesin virtual seperti Java. Oleh karena itu, program yang telah dikompilasi di suatu arsitektur Erlang dapat dijalankan di arsitektur lainnya. Bahkan program Erlang dapat diperbaharui (diupdate) tanpa menghentikan running program.

Erlang dikembangkan oleh Ericsson untuk memenuhi kebutuhan pengembangan produknya sejak 1982. Saat itu dibutuhkan suatu bahasa pemrograman yang memudahkan pemrograman di lingkungan terdistribusi dan cukup kebal kesalahan. Salah satu prasyarat bahasa tersebut haruslah bersifat simbolik tinggi serta mendukung pemrograman fungsional. Karena akan digunakan untuk aplikasi terdistribusi, maka harus mendukung konkurensi. Konkurensi ini harus cukup ditail sehingga proses asinkron telfon dapat direpresentasikan sebagai 1 proses. Penanganan kesalahan harus ditangani dengan baik.

Berikut contoh penggunaan bahasa Erlang kedalam program fungsional.

Impelementasi program factorial di Erlang:

-module(fact). % Ini adalah file 'fact.erl', modul dan filename harus match
-export([fac/1]). % Fungsi eksport 'fac' dari iterasi 1 (1 parameter, no tipe, no nama)

fac(0) -> 1; % jika 0, kemudian mengembalikan 1, sebalikanya ( artinya 'else')
fac(N) -> N * fac(N-1).
% determinasi dengan rekursif, kemudian mengembalikan hasil
% (tanda titik “.” artinya 'endif' atau 'fungsi end')

Implementasi Algoritma Quicksort:

%% quicksort:quicksort(List)
%% Mengurutkan item-item sebuah list
-module(quicksort). % Ini merupakan file 'quicksort.erl'
-export([quicksort/1]). % Sebuah fungsi 'quicksort' dengan 1 parameter yang
% dieksport (no tipe, no nama)


quicksort([]) -> []; % Jika list [] adalah kosong, mengembalikan sebuah
% list kosong (tak ada data untuk diurutkan)

quicksort([Pivot|Rest]) -> % Compose sebuah list dengan rekursif dari 'Front'
% dari 'Pivot' dan 'Back' dari 'Rest'
quicksort([Front || Front <- Rest, Front <>= Pivot]).

[Download Link]
Read More..
 

Development by Sigit Widiyanto '@2009'